Barcode Inspection - Post-Inspection Results Viewing
Summary
This section describes the post-inspection results viewing process and steps, needed after running a Barcode inspection.
Post Inspection Results
Review and Proof the Differences
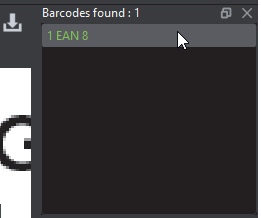
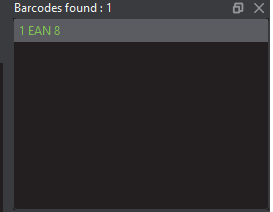
To navigate to a barcode, click on the barcode in the Barcodes found panel in the Inspection View. The Barcode Details panel displays its parameters and grades/values.
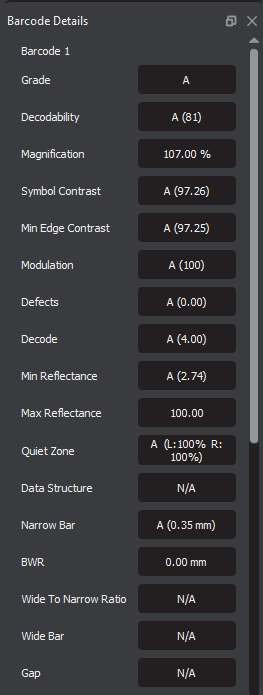
An overall (average) grade is determined for the barcode based on the values of the individual parameters. These grades appear in the Barcode Details panel.
Consult the Barcode Scan Grid to find parameter grades for each of the selected barcode's scan lines (instead of the average).
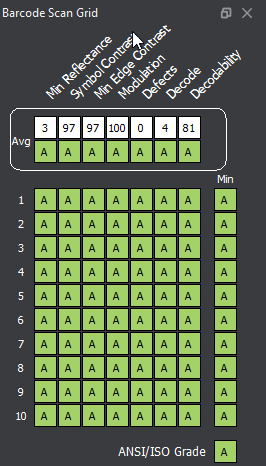
Note: The Barcode Scan Grid appears only when 1D (linear) barcodes are inspected, and it is supported for all linear barcodes at the exception of the 'USPS 4-State' & 'GS1 CC-A'.
The grades can be set to appear as numbers or letters.
Letters are the default setting, while the Grade output format must be set to Numbers in the selected Barcode Inspection profile. Standard users cannot create a new profile with the changed setting. Consult our Administration Guide for more information.
Barcodes Found Panel
To navigate to a barcode, click on the barcode in the Barcodes found panel in the Inspection View.
The Barcode Details panel displays its parameters and the accompanying grades/values. The barcode itself gets highlighted in the Inspection View.
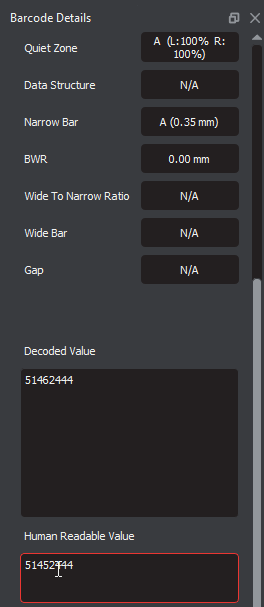
Barcode Details Panel
When inspecting UPC or EAN barcodes, the Application determines whether a decoded value matches the Human Readable Value.
A match displays in green. A non-match displays in red. The panel's upper portion list each of the selected barcode's individual parameters. The remainder of this section describes each of them in detail.
| 1 | 1D/Composite Barcode Parameters | |
| 2 | Type | Barcode type detected |
| 3 | Grade | Overall grade for the barcode; See the table below for a list of barcode grades |
| 4 | Decodability | Ease of barcode identification; The Application assigns a grade from A-F (100-0%) |
| 5 | Magnification | Percentage (+/- 10%) that a barcode has been magnified based on a starting point of 100%; Based on width to accommodate truncated barcodes and can vary from 80% to 200% except for Interleaved 2 to 5-type codes |
| 6 | Symbol Contrast | Difference in the contrast between the darkest and the lightest parts of a barcode; The system assigns a grade from A-F (100-0%) |
| 7 | Min Edge Contrast | Minimum contrast between a space and its adjacent bars; The Application assigns a pass-or-fail grade (A or F) (100-0%) |
| 8 | Modulation | The ratio between symbol contrast and minimum edge contrast; The Application assigns a grade from A-F (100-0%) |
| 9 | Defects | Amount of discrepancies in the reflectance of a barcode; The Application assigns a grade from A to F (100-0%) |
| 10 | Decode | Determination of whether the barcode was generated correctly, with sufficient spacing between bars; The system assigns a pass-or-fail grade (A or F; 4 or 0) |
| 11 | Min Reflectance | Minimum reflectance value (darkest part of the barcode); The Application assigns a pass-or-fail grade (A or F) |
| 12 | Max Reflectance | Maximum reflectance value (the lightest part of the barcode); The Application assigns a rating from 100-0 |
| 13 | BWR | A measure of the decrease in bar width needed to compensate for print gain; The Application assigns a measurement in mm |
| 14 | Decoded Value | The decoded value of the selected barcode |
| 15 | Quiet Zone | Blank margins bordering a barcode; The Application assigns a pass-or-fail grade (A or F; Left% and Right %) |
| 16 | Data Structure | Type of information that is embedded in the barcode; The Application analyzes applicable barcodes as either having valid (A) or invalid (F) data structures (GS1 data matrix and QR codes only) |
| 17 | Narrow Bar | Width of the narrow bars comprising the barcode in mm; Higher DPI values yield more precise results; The Application assigns a pass-or-fail grade (A or F) |
| 18 | Wide Bar | Width of the wide bars comprising the barcode in mm; Higher DPI values yield more precise results; The Application assigns a pass-or-fail grade (A or F) |
| 19 | Wide to Narrow Ratio | The ratio that determines narrow and wide bar widths (NB: WB); The Application assigns a pass-or-fail grade (A or F) |
| 20 | Gap | Amount of space between the last black bar of one character and the first of another in mm; The Application assigns a pass-or-fail grade (A or F) |
| 1 | 2D Barcode Parameters | |
| 2 | Type | Barcode type detected |
| 3 | Grade | Overall grade for the barcode; See the table below for descriptions |
| 4 | Symbol Contrast | Difference in the contrast between the darkest and the lightest parts of a barcode; The Application assigns a grade from A-F (100-0%) |
| 5 | Modulation | The ratio between symbol contrast and minimum edge contrast; The Application assigns a grade from A-F |
| 6 | Decode | Determination of whether the barcode was generated correctly, with sufficient spacing between bars; The Application assigns a pass-or-fail grade (A or F; 4 or 0) |
| 7 | Axial Non-Uniformity | Difference in length of the two axes of the barcode; The Application assigns a grade from A-F (0-100%) |
| 8 | Grid Non-Uniformity | Vector deviation of the barcode from an ideal position; The Application assigns a grade from A-F (0-100%) |
| 9 | Fixed Pattern Damage | Damage done to the pattern; The Application assigns a grade from A-F |
| 10 | Unused Error Correction | Amount of unused error correction embedded in the barcode; The Application assigns a grade from A-F |
| 11 | Decoded Value | The decoded value of the selected barcode |
| 12 | BWR Horizontal | A measure of the decrease in horizontal bar width needed to compensate for print gain; The Application assigns a measurement in mm |
| 13 | BWR Vertical | A measure of the decrease in vertical bar width needed to compensate for print gain; The Application assigns a measurement in mm |
| 14 | Data Structure | Type of information that is embedded in the barcode; The Application analyzes applicable barcodes as either having valid ("A") or invalid ("F") data structures (GS1 data matrix and QR codes only) |
| 15 | Cell Size | Height and width of a cell comprising the data matrix (QR code); The Application assigns a measurement in mm |
| 16 | Quiet Zone | Blank margins bordering a barcode; The Application assigns a pass-or-fail grade (A or F; Left% and Right %) |
Barcode Grades | |||
Grade | Color | Color Code | Description |
A |
| #8BC53F | Overall grade of 3.5 or higher; The barcode should scan easily the first time with most barcode scanning equipment |
B |
| #08C8F4 | Overall grade of 2.5 - 3.5; The barcode may scan easily the first time and there is a high probability of success if a second scan is performed |
C |
| #FFFB00 | Overall grade of 1.5 - 2.5; The minimum most barcodes should achieve |
D |
| #FFC920 | Acceptable only if the barcode is printed on fiberboard |
F |
| #FF4C3F | Failing grade |
N/A |
| N/A | The verification grade of the barcode symbol is not supported |
Overview Panel
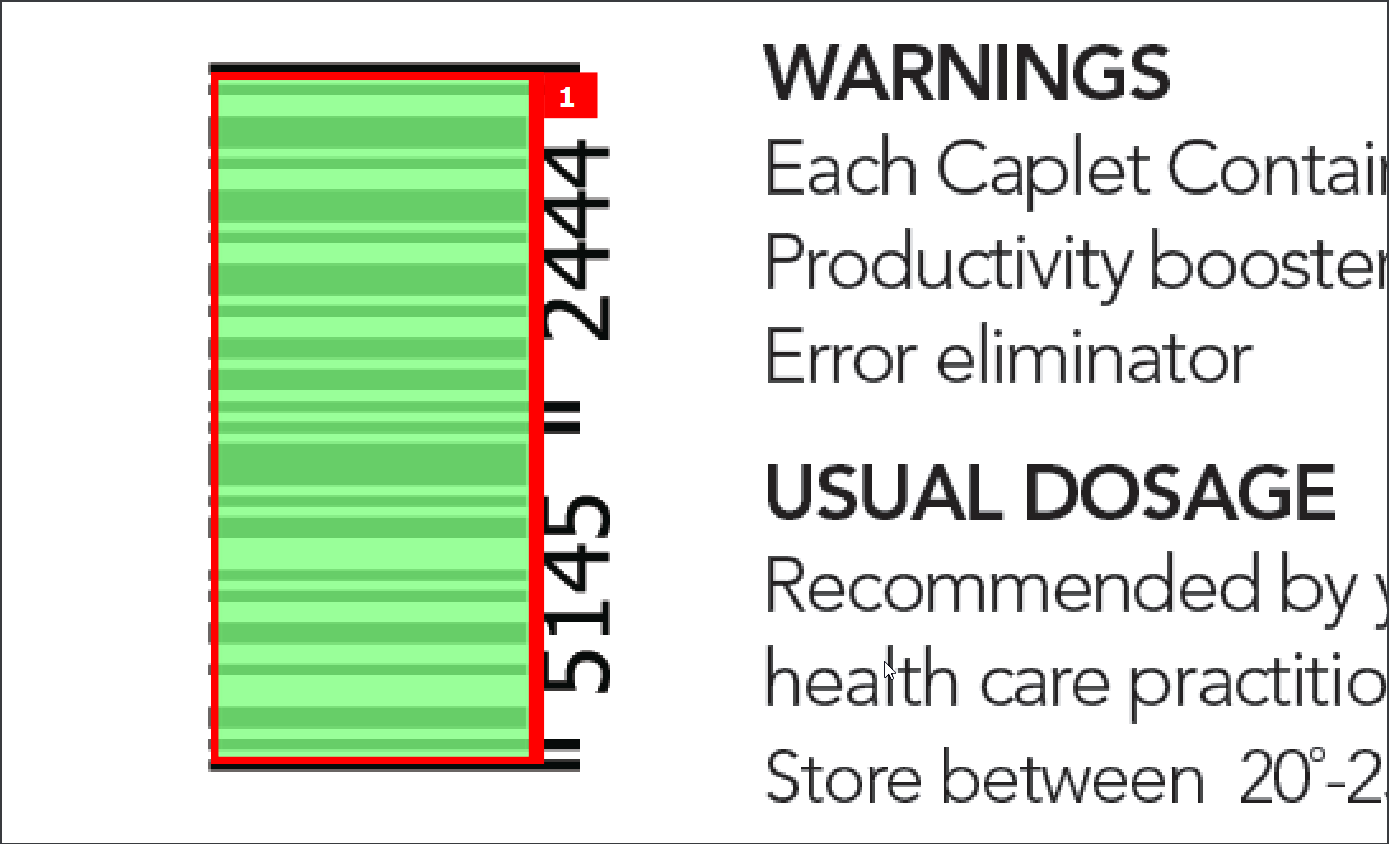
The Overview panel displays the image or inspection currently being viewed in the Inspection View. The selected barcode is located at the intersection of two red lines.
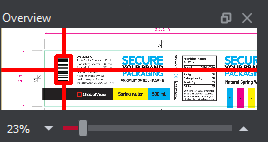
To zoom in or out of the Sample image in the Overview panel:
Slide the button in the middle of the bar accordingly to navigate to the appropriate location.